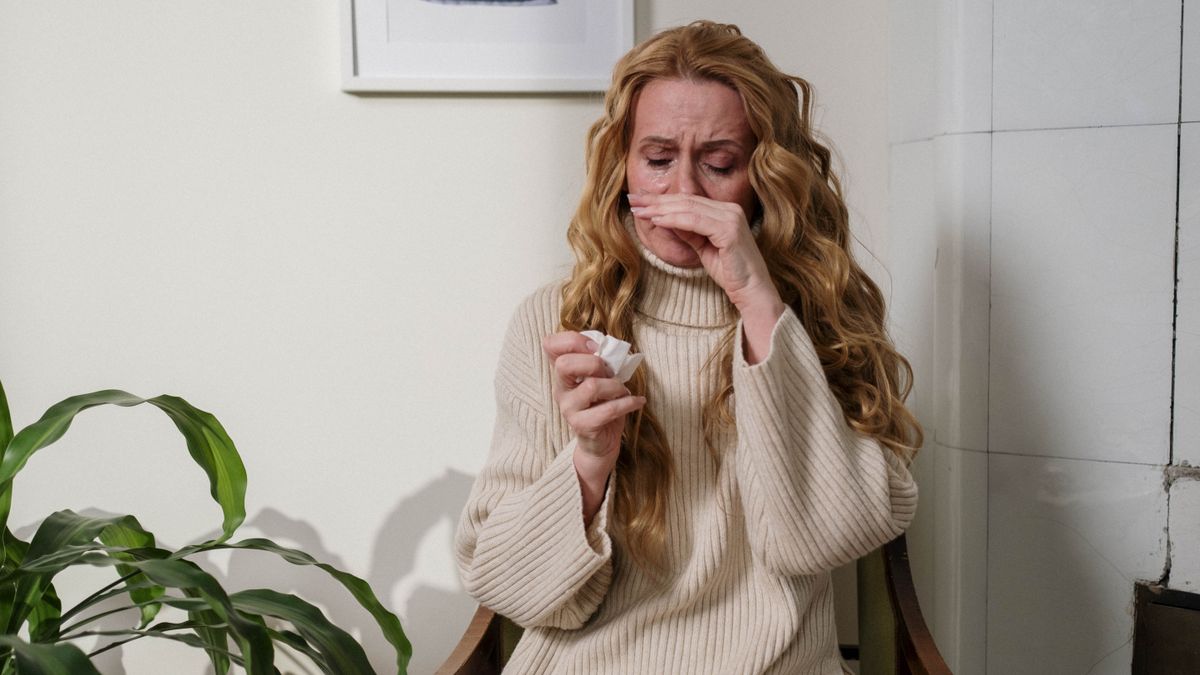
It’s one of the most common frustrations with any pollen app: the count says Low, but you’re sneezing all day. Or it reads High and you feel completely fine. What gives?
A pollen count is an average
The headline number is a regional estimate - modeled from monitoring stations, forecasts, and weather. It describes the air across a wide area, not the air in your specific backyard. Several things can make your personal experience diverge from it:
1. Your trigger isn’t the dominant pollen
A “Low” overall day can still be high for your specific allergen. If you’re allergic to ragweed and the count is being held down by low tree and grass numbers, the average hides your problem. This is exactly why SafeInhale lets you set your trigger - so your Breathe Score reflects what affects you, not the crowd.
2. Hyper-local sources
One blooming tree outside your window, or a freshly mowed lawn next door, can spike your exposure far above the regional average for an hour or two.
3. It’s not only pollen
Symptoms that look like hay fever are often made worse by indoor triggers (dust, mold, pet dander) or by air quality - ozone and fine particles irritate the same airways. SafeInhale folds AQI into your score for this reason.
4. Timing and weather
Counts swing through the day - often peaking in the early morning and on warm, dry, breezy afternoons. Rain temporarily clears the air, then counts rebound once it dries out. A daily average smooths all of that away.
What helps
Track your symptoms against the daily numbers for a couple of weeks. Patterns emerge fast - and they’re usually more useful than any single day’s count.
Set your triggers and watch the trend on the pollen & air page.
Informational only - not medical advice. Persistent symptoms are worth a conversation with a clinician.